Home Pages
Personalized, Informative and Makes you Smarter!

You know that feeling you get when you say something really intelligent or when you’re right on point about a topic or anticipate the next step before anyone else does? That’s what a good Home Page can do for you on your Salesforce App. It‘s like a super efficient personal assistant that helps you be…

The home page is what a user sees first after logging in. It can be customized to highlight information specific to the user and all the information is visible on one tab. When you go to your Home, you want to see what’s important to you and your business. On the Hawaii Literacy project, we customized the Home Page using the Lightning App Builder to show the information they needed to manage their volunteers efficiently. The key metrics that show are the number of Unmatched Tutors and Students, Active vs Inactive Tutors and Students, Tutors that have submitted monthly reports, etc. All this information provides them with actionable tasks to keep them up to date and shows them what they need to follow up on.

So how can you customize a Home Page? Lightning App Builder! I wrote about customizing object page layouts in a previous post (remember the Chickens?) —customizing the Home Page is no different.

Click on the gear icon and select Edit Page to get you to the Lightning App Builder page. Use the Components menu on the left side to drag and drop onto the canvas. Here, we are dragging the Dashboard component onto the canvas.

To the right of the canvas, you will see the details of the component that is highlighted (click on the component to highlight). You can select a pre-built Dashboard from the “ *Dashboard ” drop down menu.

On this Home Page we used a pre-built Dashboard called “Home Page (Hiap Dashboards)” that displays 4 report charts.

Then we dragged the Recent Items component onto the canvas to show their latest activities. Where you place the component on the canvas determines where it will appear on the Home Page.

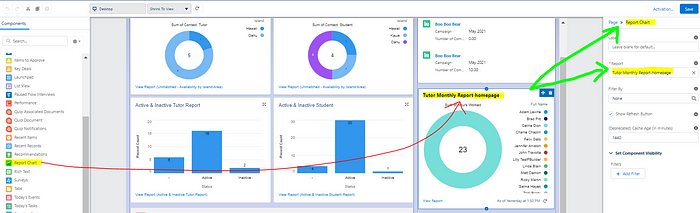
We also added Report Charts to the canvas to show other key metrics. On the screen’s right side detail section, you can see the component type and select the “ *Report “ from the drop down menu.
Last, we dragged a Tab component onto the canvas.
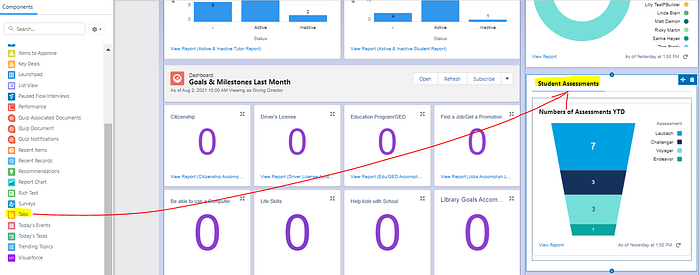
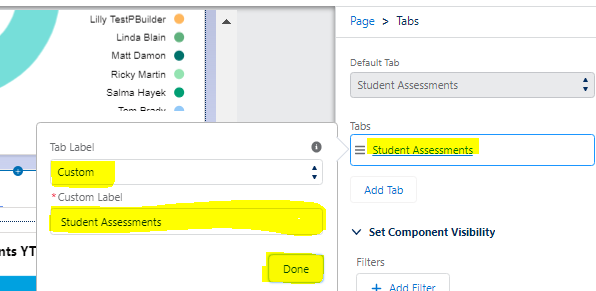
To name this Tab section, “Student Assessment,” click in the Tabs field box, select the “Custom” Tab Label and enter the name in the “Custom Label” field box, then Done.
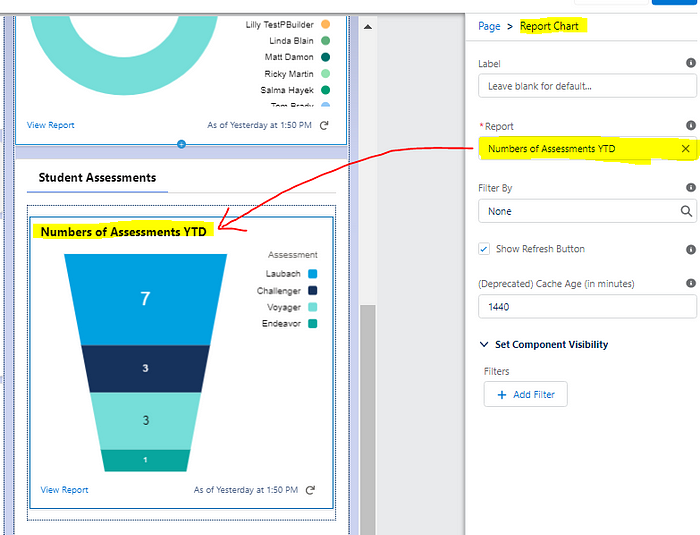
To add a component into this Tab section, click on “Student Assessment” and “Add Components Here” will auto appear in the box below it. Drag the component you want from the left margin into the Tab section — we selected Report Chart.
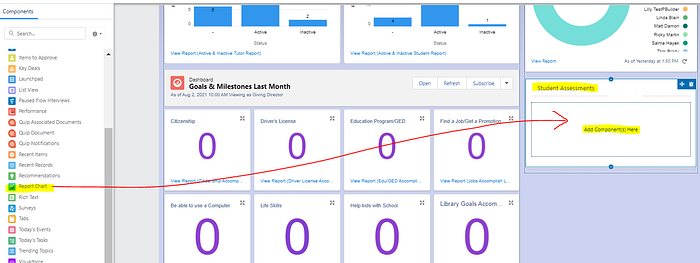
Define which report chart you will display on the “Student Assessments” Tab by selecting the report from the drop down menu of the “ *Report “ field. For Hawaii Literacy, we selected the “Numbers of Assessments YTD” report
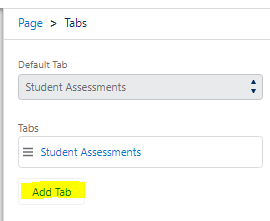
You can nest other Tabs into this section by clicking on Add Tab.
The default Tab is “Details,” but you can select from the “Tab Label” drop down menu then click Done.
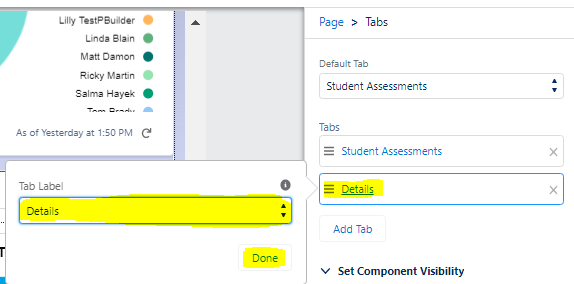
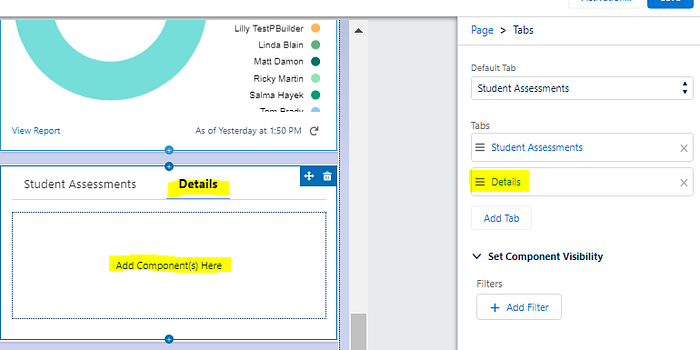
Now we have the second tab “Details” and you can now add a component to the Details tab.
After all your modifications, be sure to click on Save, then Activation!
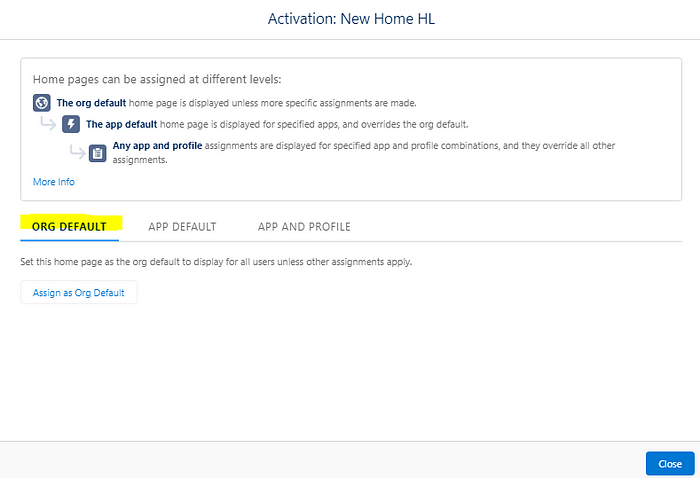
In order for the user to see the changes for the Home Page, you’ll also have to click on Activation. Saving alone will not make it visible to a user. There are 3 levels for Activation:
Org Default —Page is set to Org default and all users in org have access. Click on Assign as Org Default and Close.
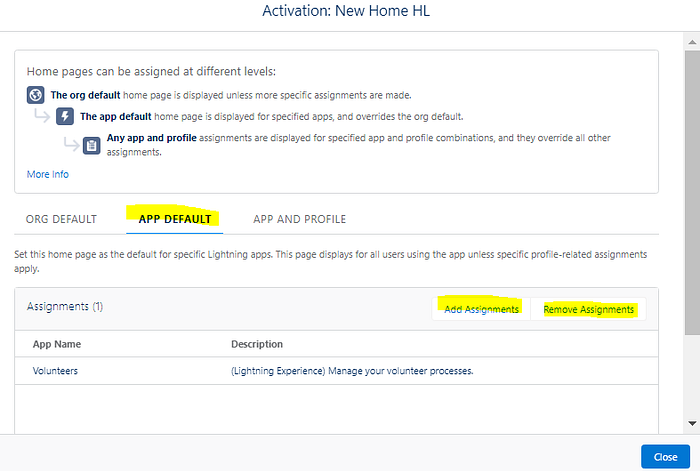
App Default —Page is set as default for a specific, defined App and all users that have access to this App also have access to this page. To add or remove Apps that will use this Home Page, click on Add Assignments or Remove Assignments buttons. In this example, only the Volunteers App uses this Home Page. Then click on Close.
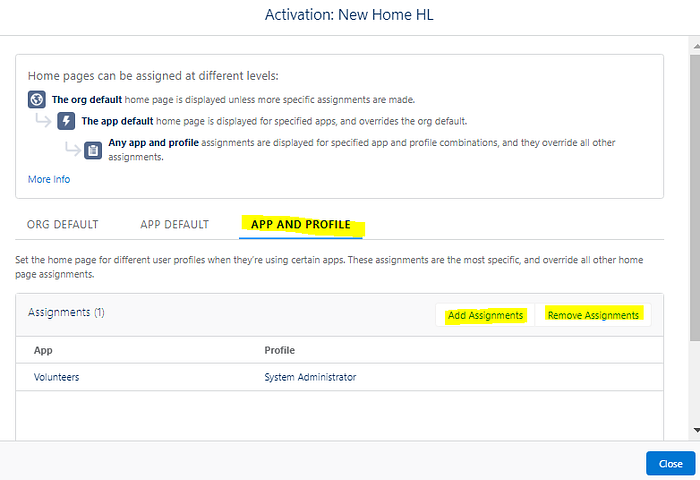
App and Profile — Page is set as default for a specific, defined App and Profile. Only users within this Profile have access to this Home Page. To add or remove Apps that will use this Home Page, click on Add Assignments or Remove Assignments buttons. You can then specify the Profile. Then click Save and Close.
On the Home Page, are you wondering where the Report Charts come from? Your Reports! You can access the Reports that are being used on your Home Page by clicking on View Report below the chart.
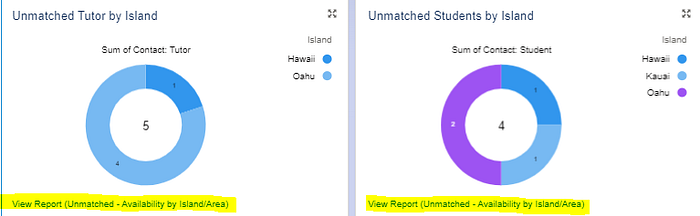
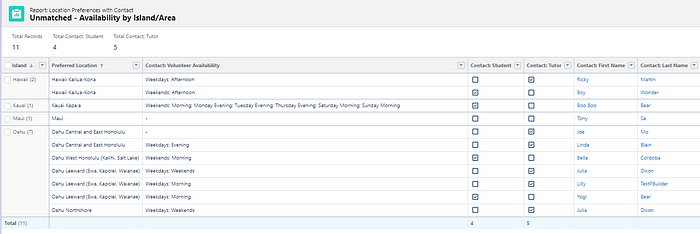
If you clicked on “View Report (Unmatched — Availability by Island/Area)”, then you will be directed to the report.
I hope you see how easy it is to customize a Home Page so it shows you the exact information that will help you reach your goals and feel great about yourself!

Join me next week to discover a new feature on a Salesforce project I’ve done.
Mahalo,
Lizette